HomeLab/Snort3 ELK Visualization
Prerequisite
- Ubuntu 20.04 with root access* Snort 3.0 up and running with community rules* Open App ID* Elastic Stack up and running
In this guide we will visualize Snort3 logs in Kibana. I've setup Elastic Stack as an LXC with 300 GB disk space for storing logs. Elasticsearch consumes alot of storage when indexing data. If you've enabled all the rules in Snort3, you will generate ALOT of logs. Keep that in mind.
In my enviroment I use Hyper-v as my hypervisor. I've enabled port mirroring so all my VMs sends a copy of all network packets to my Snort3 sensor. That way Snort3 can monitor traffic to and from my VMs.
Snort3 is very lightweight and can be deployed easliy on multiple servers. It is up to you to determin where you want to place your sensors. If you want to capture ALL traffic that comes through to your network, its recommended to place Snort3 on the firewall. That way you can determin what kind of traffic actually passes through your firewall.
Configuring Snort3
In order to easily import Snort3 alert log files to Elasticsearch, we will use json output plugin. You have to enable json in your Snort3 configuration file, snort.lua.
sudo vim /usr/local/etc/snort/snort.lua
Enable alert_json, and comment out all other outputs.
-- 7. configure outputs
-- event logging -- you can enable with defaults from the command line with -A -- uncomment below to set non-default configs --alert_csv = { -- file = true, --} --alert_fast = { } --alert_full = { } --alert_sfsocket = { } --alert_syslog = { } --unified2 = { } alert_json = {
       file = true,
       limit = 100,
       fields = 'seconds action class b64_data dir dst_addr dst_ap dst_port eth_dst eth_len eth_src eth_type gid icmp_code icmp_id icmp_seq icmp_type iface ip_id ip_len msg mpls pkt_gen pkt_len pkt_num priority proto rev rule service sid src_addr src_ap src_port target tcp_ack tcp_flags tcp_len tcp_seq tcp_win tos ttl udp_len vlan timestamp',
}
Your alerts should look like this. You can find your alerts in /var/log/snort.
{ "seconds" : 1601706643, "action" : "allow", "class" : "none", "b64_data" : "EWTumwAAAAA=", "dir" : "C2S", "dst_addr" : "224.0.0.1", "dst_ap" : "224.0.0.1:0", "eth_dst" : "01:00:5E:00:00:01", "eth_len" : 60, "eth_src" : "30:91:8F:E5:84:5E", "eth_type" : "0x800", "gid" : 116, "iface" : "eth0", "ip_id" : 0, "ip_len" : 8, "msg" : "(ipv4) IPv4 option set", "mpls" : 0, "pkt_gen" : "raw", "pkt_len" : 32, "pkt_num" : 15712049, "priority" : 3, "proto" : "IP", "rev" : 1, "rule" : "116:444:1", "service" : "unknown", "sid" : 444, "src_addr" : "192.168.1.1", "src_ap" : "192.168.1.1:0", "tos" : 192, "ttl" : 1, "vlan" : 0, "timestamp" : "10/03-08:30:43.077350" }
Run Snort3 in daemon mode.
sudo vim /lib/systemd/system/snort3.service
Paste this content. Change the ethernet adapter to match your adapter.
[Unit]
Description=Snort3 NIDS Daemon
After=syslog.target network.target
[Service] Type=simple ExecStart=/usr/local/bin/snort -c /usr/local/etc/snort/snort.lua -s 65535 -k none -l /var/log/snort -D -u snort -g snort -i eth0 -m 0x1b
[Install] WantedBy=multi-user.target
The -D flag specifies that Snort3 should run in daemon.
Now enable Snort3 SystemD service.
sudo systemctl enable snort3
sudo service snort3 start
Check the status of the service:
service snort3 status
Configuring Logstash
Now that you have Snort3 configured correctly and Elastic stack setup, we can now move on to sending logs to Elasticsearch.
There are different ways you can achieve this. Either by using Filebeat to ship logs to Logstash, or setting up Logstash on your host. We will setup Logstash on the host. Keep in mind that this will consume more resources because it uses Java coupled with the implementation in Ruby.
When you've setup Logstash on your host, create a conf file in /etc/logstash/conf.d and call it snort_json.conf. This will collect all your Snort3 logs and send them to elasticsearch.
sudo vim /etc/logstash/conf.d/snort_json.conf
In the conf file, paste this content and modify it so it matches you're variables. Verify that the path => is correct and the output is pointing to your elasticsearch server.
input {
   file {
       path => "/var/log/snort/alert_json.txt"
       start_position => "beginning"
       sincedb_path => "/dev/null"
   }
}
filter {
   json {
       source => "message"
   }
   mutate {
       convert => {
           "pkt_num" => "integer"
           "pkt_len" => "integer"
           "src_port" => "integer"
           "dst_port" => "integer"
           "priority" => "integer"
       }
       gsub => ["timestamp", "\d{3}$", ""]
   }
   date {
       match => [ "timestamp", "yy/MM/dd-HH:mm:ss.SSS" ]
   }
   geoip { source => "src_addr" }
}
output {
   elasticsearch {
       hosts => "http://192.168.1.217:9200"
       index => "logstash-snort3j"
   }
   stdout { }
}
Now, create a new conf file in the same directory and call it snort_apps.conf.
sudo vim /etc/logstash/conf.d/snort_apps.conf
And copy this text to your conf file.
input {
   file {
       path => "/var/log/snort/alert_json.txt"
       start_position => "beginning"
       sincedb_path => "/dev/null"
   }
}
filter {
   json {
       source => "message"
   }
   mutate {
       convert => {
           "pkt_num" => "integer"
           "pkt_len" => "integer"
           "src_port" => "integer"
           "dst_port" => "integer"
           "priority" => "integer"
       }
       gsub => ["timestamp", "\d{3}$", ""]
   }
   date {
       match => [ "timestamp", "yy/MM/dd-HH:mm:ss.SSS" ]
   }
   geoip { source => "src_addr" }
}
output {
   elasticsearch {
       hosts => "http://192.168.1.217:9200"
       index => "logstash-snort3j"
   }
   stdout { }
}
Verify that Elasticsearch is collecting the data
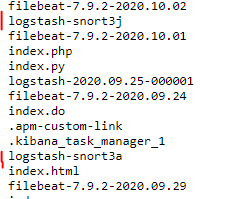
Point your browser to http://elasticsearch_addr:9200/_cat/indices?v
Verify that both logstash-snort3j and logstash-snort3a indexes are present.

Visualize the collected logs in Kibana
There are a couple of ways to do to visualize logs in Kibana. There are some premade dashboards that you can find online, or you can create your own dashboard.
I've chosen to create my own dashboard. But first there are a couple of steps that needs to be done first.
Point your browser to http://kibana_addr:5601/ and follow these steps.
- Click on the Stach Management> Index Patterns > Create index pattern, set the name to logstash-snort3j, and click Create.* Click on the created index pattern and edit the b64_data. You can find it in "Fields". Set Format = String and Transfor = Base64 Decode and then click update field.* Click on stach Management > Index Patterns > Create Index, set the name to logstash-snort3a, and then click create. * Click the scripted fileds tab, + Add Scripted Field, set Name = app_total_bytes and Script = doc['bytes_to_client'].value+doc['bytes_to_server']. value and then click Create field.
Now you can see if you can find the data in Discover. Click on the Discover tab and change the index pattern to one that you just created.

You can see that the logs are being collected and presented in Kibana.
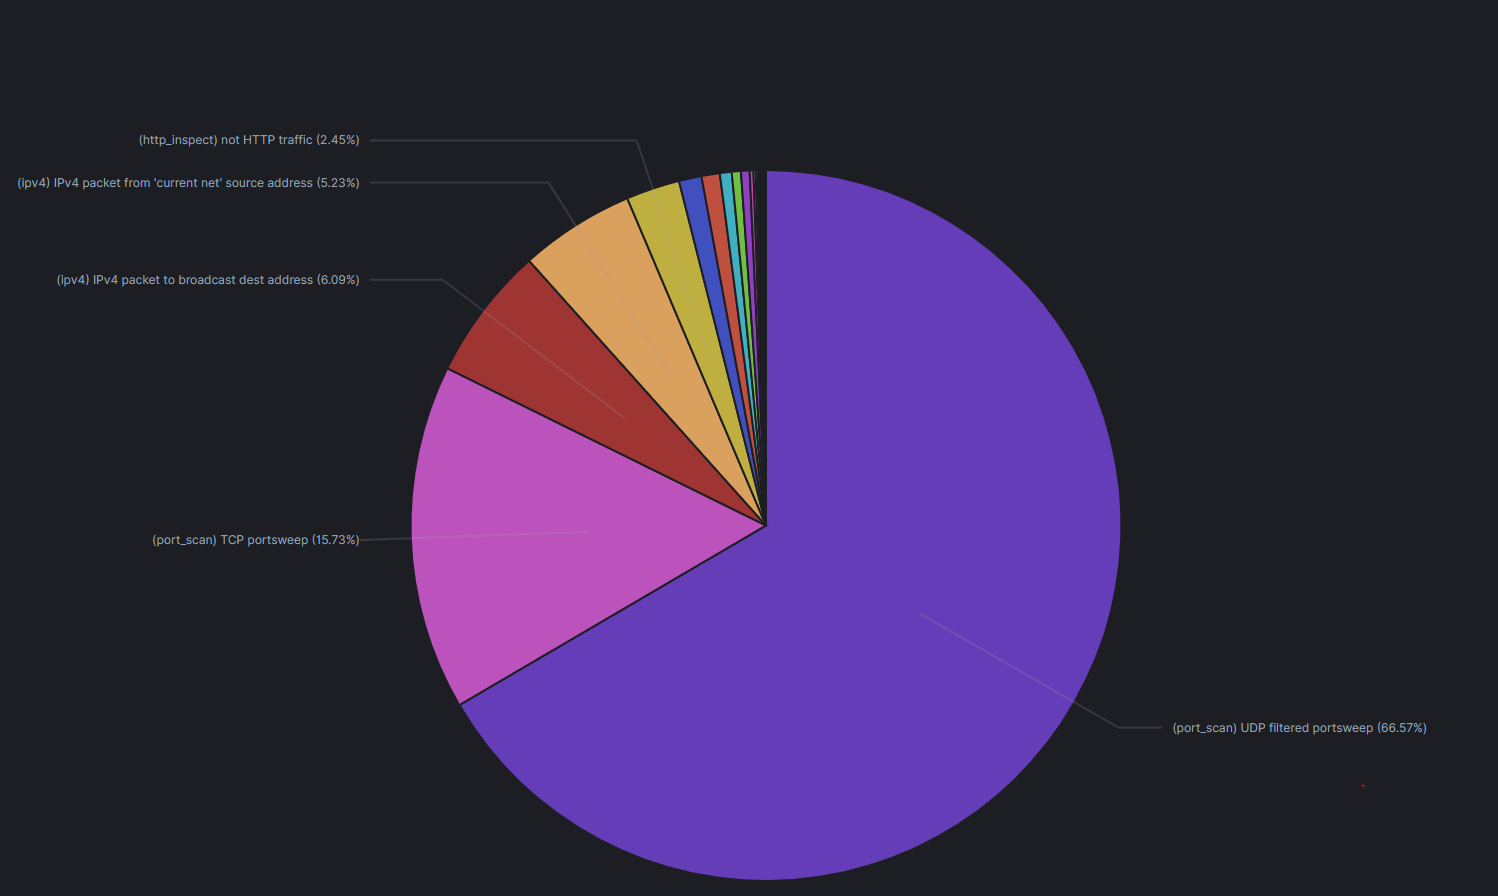
Now you want to visualize the logs in a nice looking pie chart, or a visualization of your choosing. We will create a piechart that shows us top alert messages that snort3 have collected.
- Click on Visualize > Create visualization > Pie > Types, choose Index Pattern and click on logstash-snort3j. * In the option field disable Donut, and enable Show labes. * Add a bucket > Split slices > Select Terms as the aggregation. * In the Field, select msg.keyword and click Update.

Congrats, you've now created your first visualization. Now save it and give it a name. Add this visualization to a dashboard.
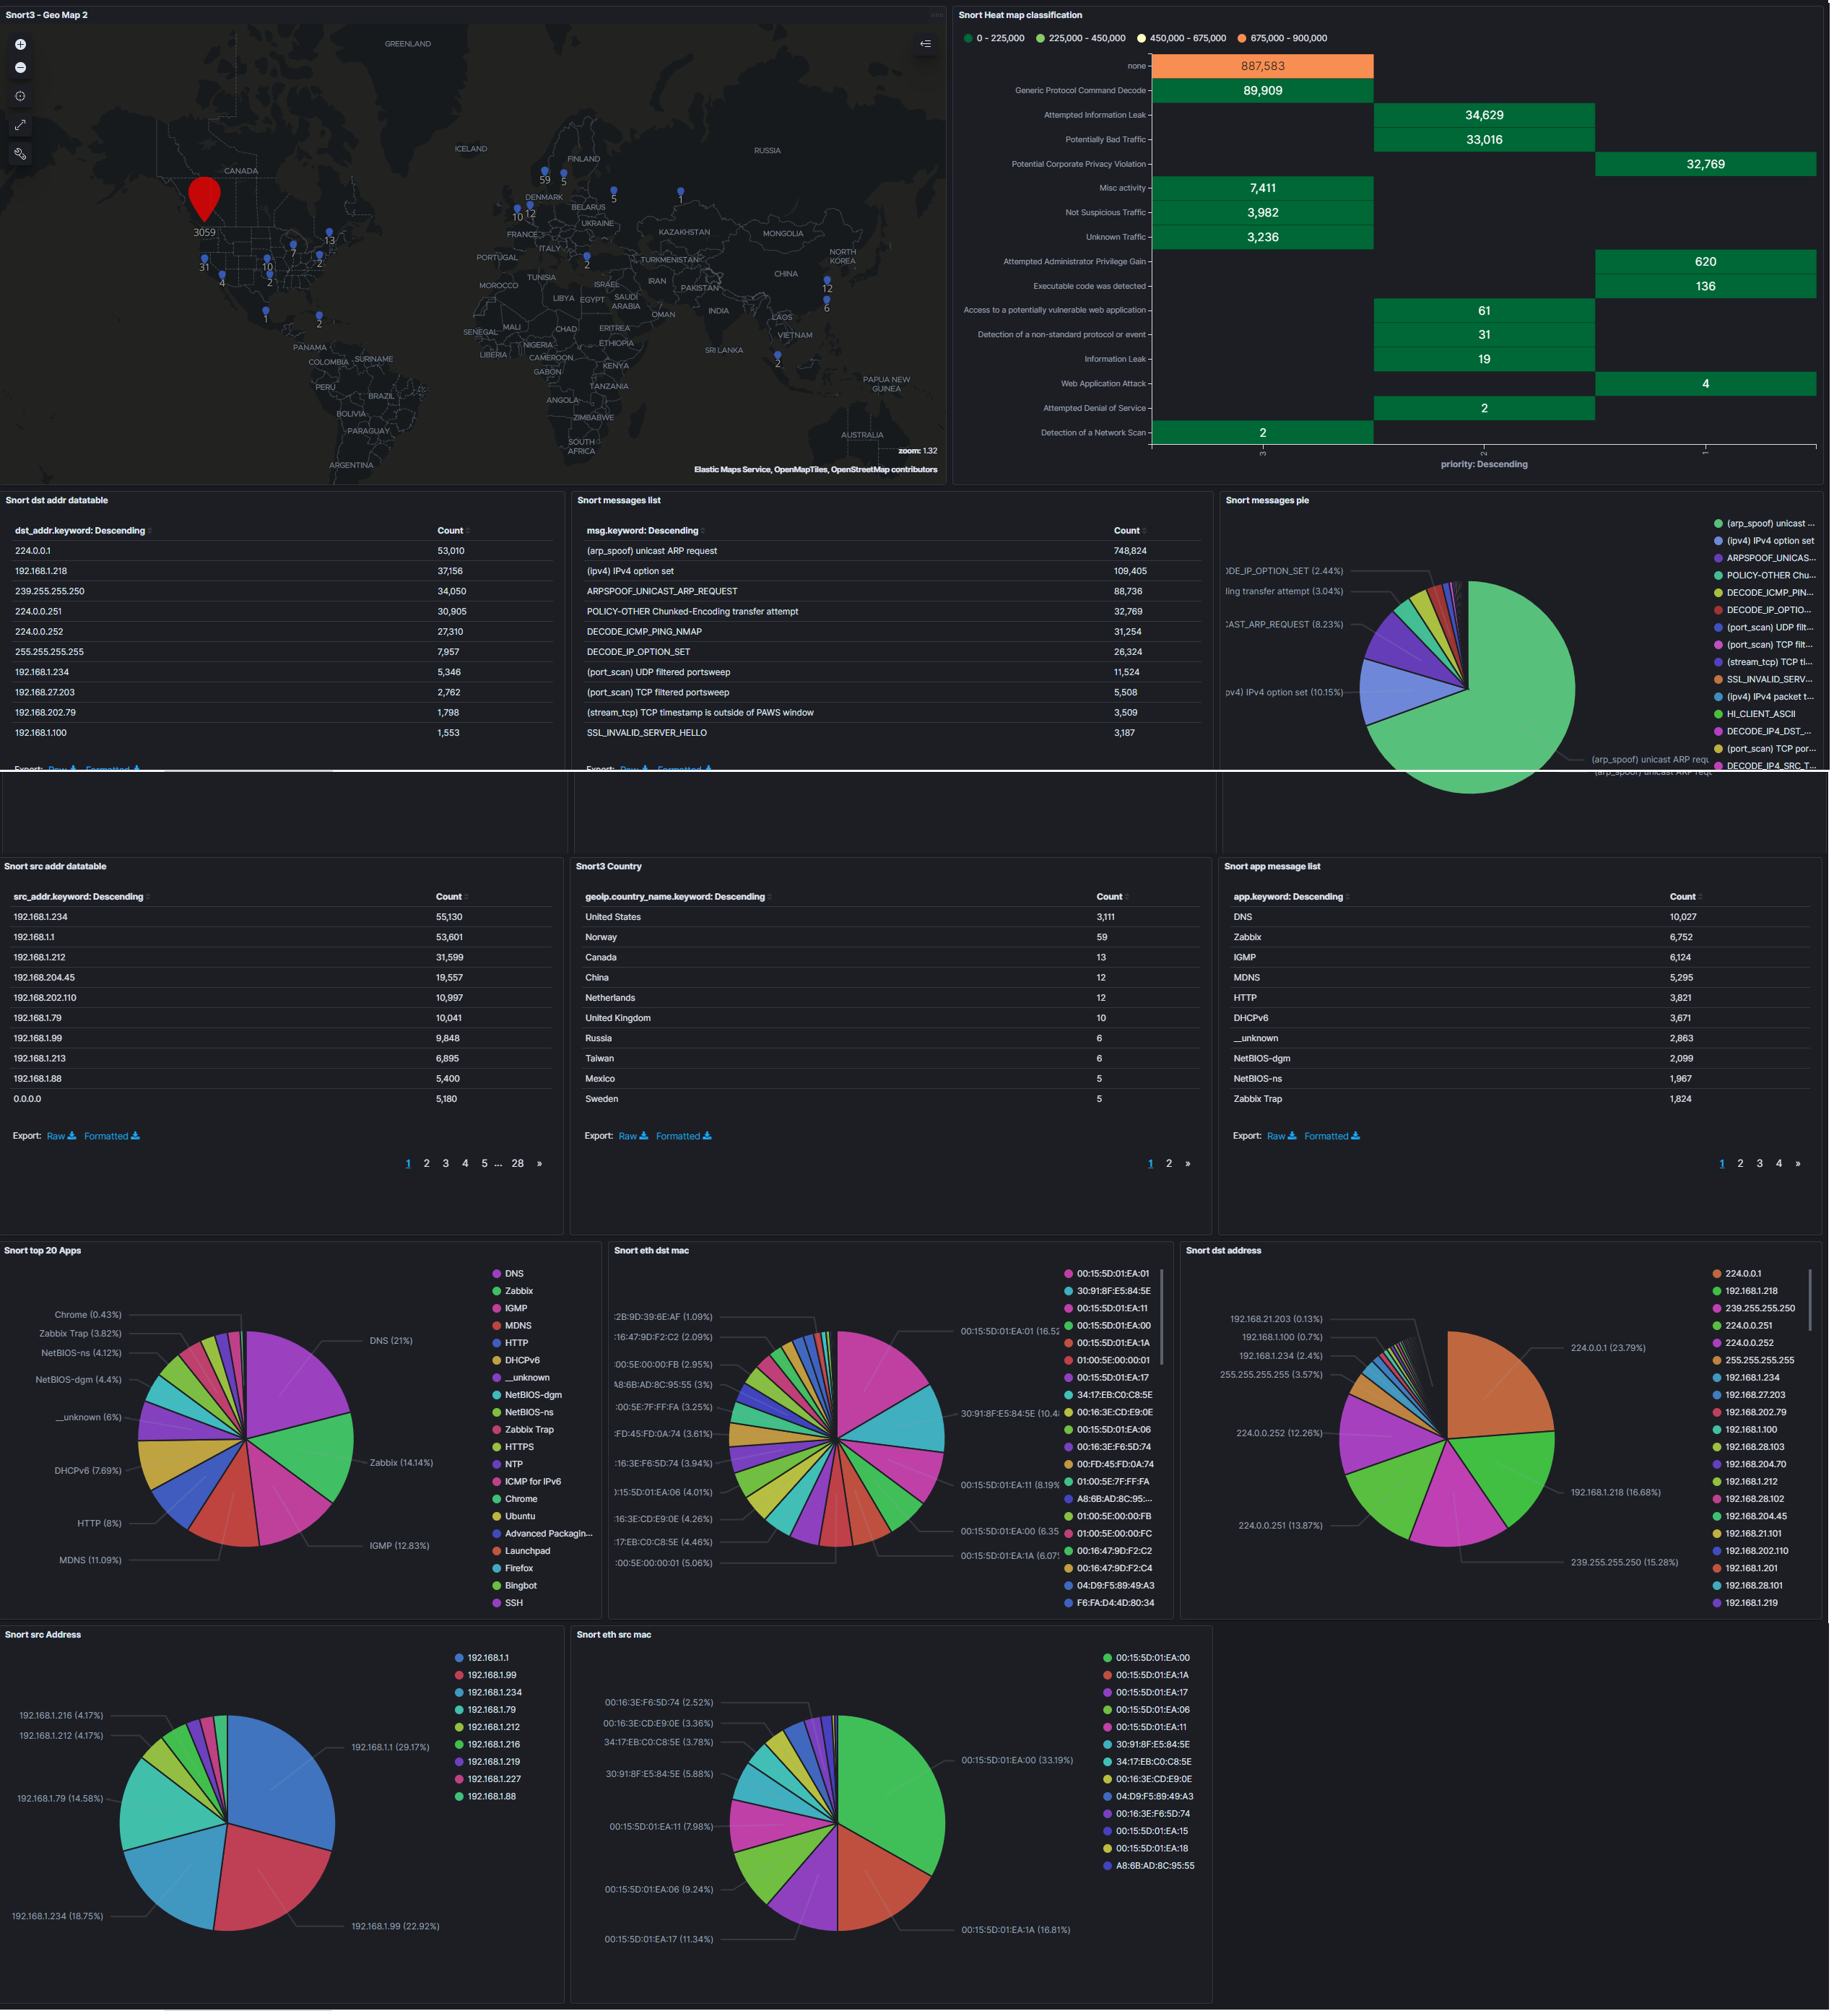
You should play around in Discover tab to find out what you want to visualize. My dashboard looks like this. You can copy it, or create your own.
